Step 2 · Data Library
The project's datasets, level by level
Every observation, product, figure and calibration record in the research archive, catalogued with its processing level, calibration scale, source availability and known limitations. Datasets that are known to exist but are not yet in the archive are listed too.
Processing levels
L0 → L8: from recorded spectrum to reproduced result
Each level is made from the ones below it. The chips show where the datasets in the archive sit. Click one to open its record.
Terminology. L0 here means the averaged power spectra written by the acquisition software. DISH222 does not store raw I/Q radio samples, so no dataset in the archive is "raw SDR data".
26 Aug 2026 · outer-Galaxy raster with DISH222
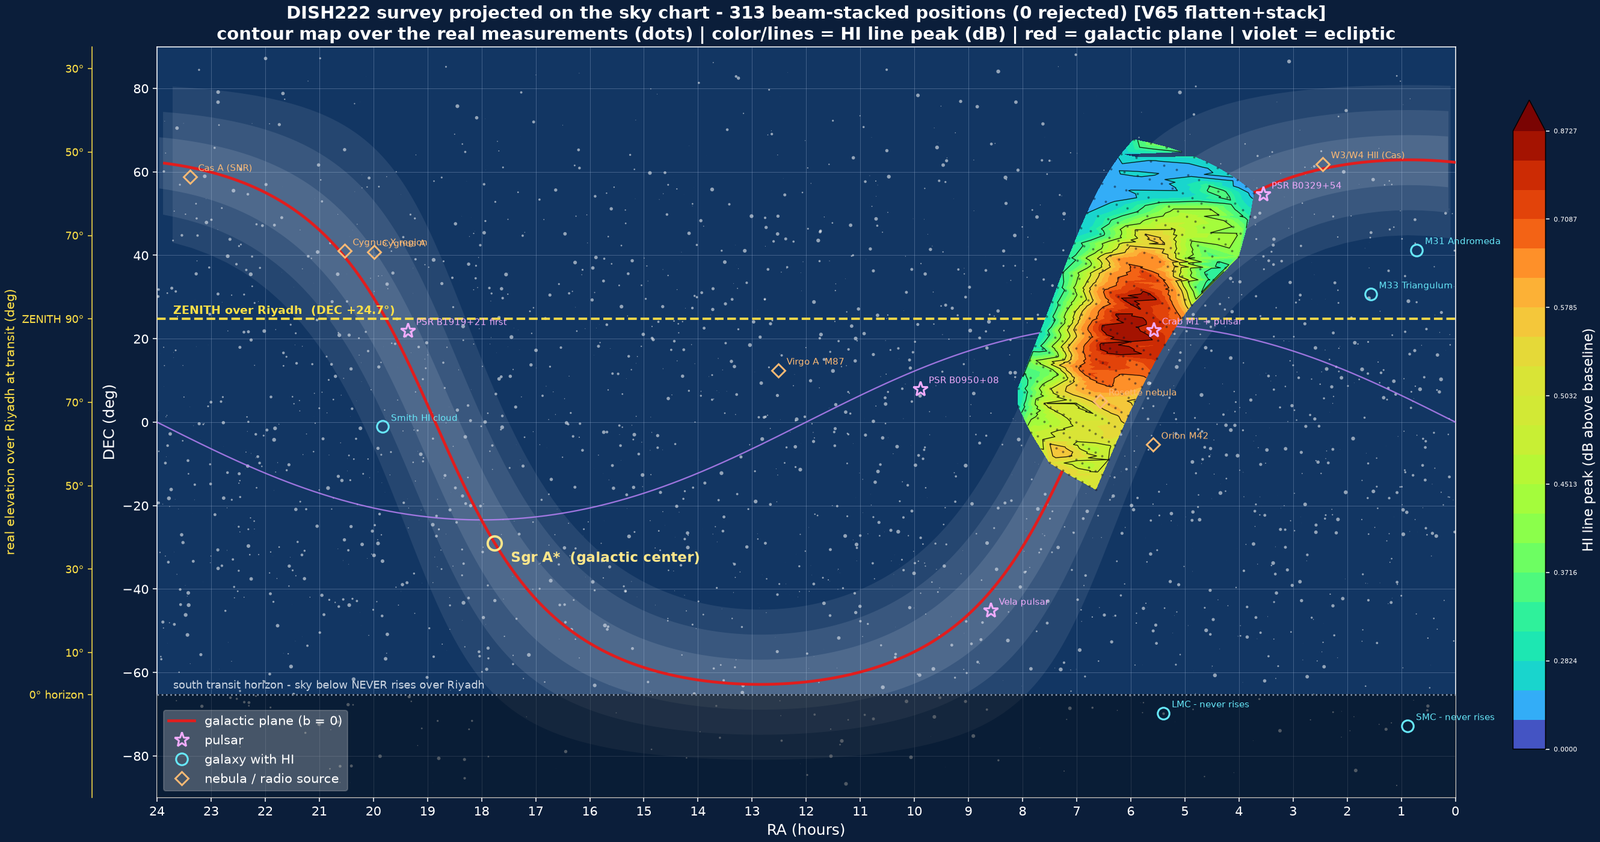
An automated raster from 02:48 to 05:48 UTC across Galactic longitudes 146°–226° and latitudes −10° to +20°. It is currently the strongest reproducible chain in the archive: the native averaged spectra (776 files) and the pointing manifest (313 positions) are both available, alongside every product made from them.
All products of this session are on the relative C0 (dB above baseline) scale. The external processing code that produced the tables and FITS files is not in the archive, so re-deriving them from the native spectra is itself a research task (Track A).
- Acquisition
- Processing
- Science product
- Visualization
Showcase product
The all-sky "TRUSTED" composite
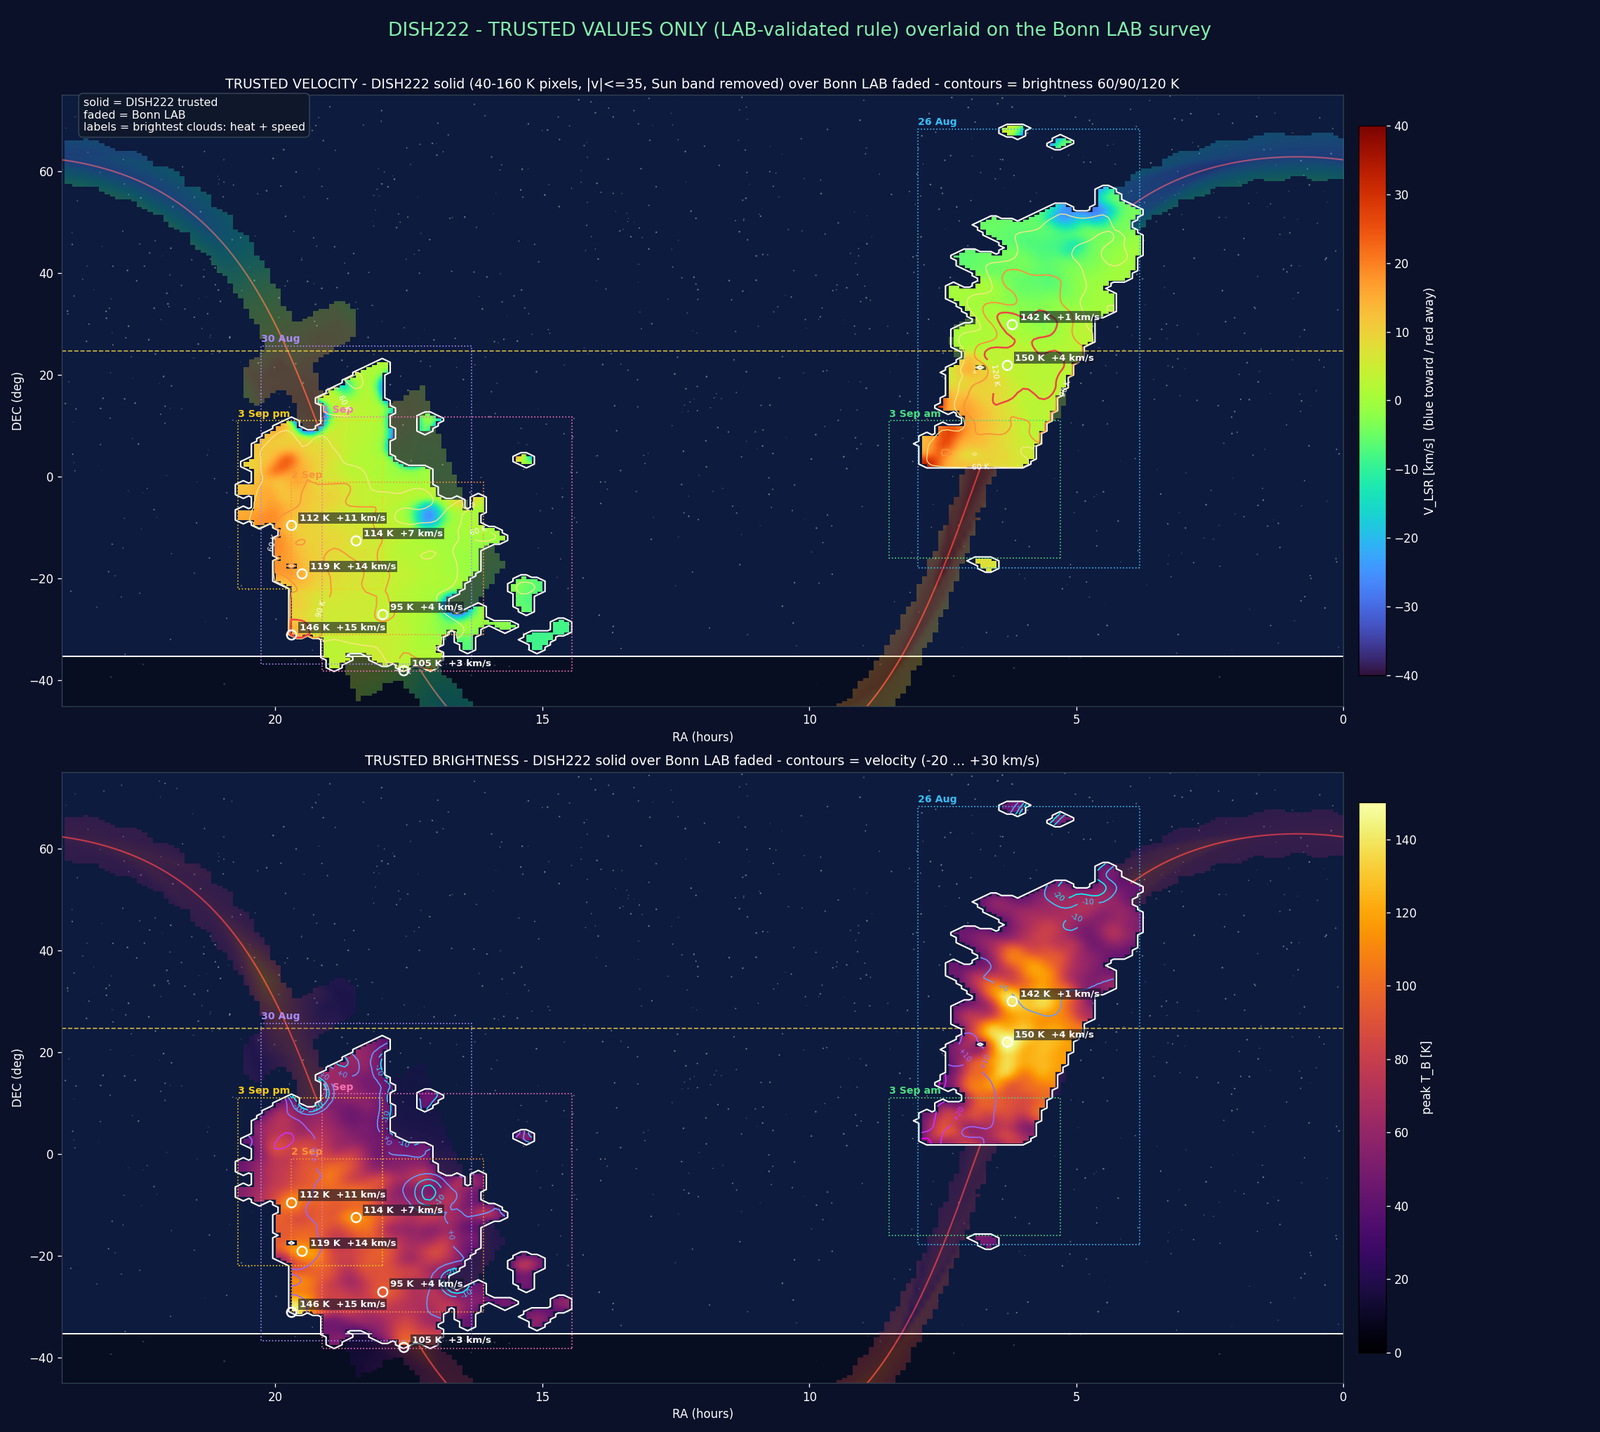
This composite combines six observing sessions between 26 Aug and 3 Sep 2026 into one map of peak brightness and velocity, overlaid on the LAB reference survey. It keeps only pixels that pass a selection rule (40–160 K, velocities within ±35 km/s, a dawn Sun band and speckles removed).
Showcase, not a starting point. It is a derived, curated (L6) product whose native lineage is incomplete in the research archive: only one of its six source sessions has native spectra available. Its selection cuts remove faint and high-velocity gas by construction. Its calibration is not recorded in the product metadata; the historical C2 scale is inferred from project chronology (C2 was in use when the composite was made).
Browse
All catalogued datasets
Open a record for its purpose, processing, calibration, lineage and known limitations. Research files are held in the project's research archive and are not published on this site. Ask the project team about access.